

Solving The Bandit Problem With A Coding Example
Hey, fellow learner! This post is a continuation of the previous post in which we learnt about the multi-armed bandit problem. In this post we will continue on that topic by focusing on implementing the epsilon-greedy algorithm in code. Additionally, we will make some analysis of the epsilon-greedy algorithm and do a short comparison with the classical A/B testing algorithm. The comparison will be regarding two critical metrics: optimality score and how often the algorithm correctly identifies the best arm. And before we begin – make sure to grab a snack and a fresh brew of coffee. Ready? Good. Welcome to the learning journey, and let’s dive in:
Backstory
As our dear friend Dr. Carl from the previous post moved to Banditville, he suddenly realised his passion for birdwatching. As luck would have it Banditville is also famous for being a summer resting place for a particular breed of birds called the Great Potoo. Now, there are about 5 possible locations in Banditville where Carl could go to spot potoo-birds but he has no clue as to which location is the optimal one. The birds are only here for about 90 days in the summer months. This means he has limited opportunites to observe them and has to find out which spot is the best while at the same time maximising his chances of seeing one of these magnificent birds. Naturally he realises that this is a multi-armed bandit problem and since he just learnt about an algorithm for solving his problem he goes straight to his computer to hack it out!
Ok, with the scenario down, let’s write this problem in code! We first start by defining a class called Bandit and write the constructor.
import numpy as np

class Bandit:

    def __init__(self, n=5, days=90, verbose = True):
        self.n = num_locations
        self.locations = np.random.random(n)
        self.sightings = np.zeros(n)
        self.attempts = np.zeros(n)
        self.efficiency = np.zeros(n)
        self.days = days
        self.verbose = verbose
Now every time we initialise an instance of the Bandit-class we will create a bandit problem with n number of arms, the number of locations we consider visiting, decided by the variable n. For code readability this We then assign each arm with a random value between 0 and 1, in the variable locations. This will represent the probability of sighting a potoo, with 0% being no chance and 1 being 100% chance.
We then introduce the three variables sightings, attempts and efficiency. Sightings keeps track of how many potoos we’ve seen at each location so far. Attempts keeps track of how many times we’ve visited each location and done birdwatching.
Efficiency is the relative chance of spotting a potoo-bird at each location. It is derived from the two others following the formula:

Efficiency will be used in order to determine which location currently seems to be the most promising. The reason for not simply using the sightings variable is that we will not visit each location (try each arm) an equal amount of times. Hence the more times we visit a given location the likelier it is that location would be associated with many sightings. But we don’t want the absolute number but the relative number as an approximation of probability.
Finally we need the days variable, which tells us how many times we will run the experiment – i.e. how many days we have at our disposal. We will also use the verbose variable to help control what we later print out.
After the constructor is written we write a few auxiliary methods:
def update_efficiency(self):
    self.efficiency = self.sightings / (self.attempts + 0.0000001)

def reset(self):
    self.sightings = np.zeros(self.n)
    self.attempts = np.zeros(self.n)
    update_efficiency()

def print_statistics():
    print("Experiment Finished! :)")
    print("Estimated location sighting probabilities are:",self.efficiency)
    print("Actual location sighting probabilities are:",self.locations)
    sighting_chance = np.sum(self.score)/np.iterations
    print("Your average chance of sighting a bird was",sighting_chance*100,"% which is",sighting_chance/np.max(self.arms)*100,"% optimal!")
The first method update_efficiency simply calculates the probabilities of spotting a bird at each location from the data observed so far. We introduce a small computational trick by adding + 0.0000001 to the denominator. This ensures that we never divide by zero (which would yield an error) and has no real impact on the accuracy of our model to speak of.
The second method reset simply serves as a way to reset the results gained from previous experiments. This allows us to run several consecutive experiments with the exact same bandit problem initialisation (i.e. number of arms and each arm probability).
The third method print_statistics is as the name implies a way to print statistics about the experiment after we’ve finished. We print the efficiency variable so the expected probabilities can be compared to the real probabilities. Finally the metric sighting_chance is computed as a measure of how close you were to the optimal strategy. sighting_chance is computed as the (averaged) probability of sighting a bird and it is compared to the strategy of always choosing the best option. An optimality score of 1 means that your strategy was 100% optimal and that you essentially always chose the best option. This is optimality measure is closely related to the concept of regret (which measures the difference between the score you got and the optimally best score possible). We will return to regret in future posts, don’t worry.
Next up we define the visit method, which will represent the act of choosing a certain location to birdwatch at.
def visit(self,location):
    p = np.random.random()
    if( p < self.locations[location]):
        self.sightings[location] += 1
    self.attempts[location] += 1
    update_efficiency()
In this method we have the input parameter location which is the index of the location we wish to choose (between 0 and n). We start by creating a random variable p using the python library numpy. p will have a value between 0 and 1, and we then compare the value p with the probability of the chosen location. If p is smaller then we saw a bird and we update the sightings for that location with 1. We then (regardless of whether we saw a bird or not) update the attempts variable for that location by one and recompute the efficiency variable.
The only remaining code to write now is the actual algorithm:
def epsilon_greedy(self,eps=0.1):

    self.reset()

    for day in range(self.days):
        p = np.random.random()
        if(p < eps or day == 0):
            location = np.random.randint(0,self.n)
        else:
            location = np.argmax(self.efficiency)
        self.visit(location)
    if(verbose):
        self.print_statistics()
We begin by resetting any stats from previous experiments. Then we iterate algorithm for the number of days set when creating the Bandit object. At each iteration we start by comparing the random variable p to the variable eps, which represents our chance of exploration. If it p is lower we choose to visit any random location (represented by the index number in locations). If eps is greater we choose to visit the most promising location. After we’ve decided which location to visit we then call the visit method written above. After the for-loop has iterated over all days we finally print the results using the print_statistics method (if the verbose variable is set to True).
The code in whole is shown below:
import numpy as np

class Bandit:

    def __init__(self, n=5, days=90, verbose = True):
        self.n = n
        self.locations = np.random.random(n)
        self.sightings = np.zeros(n)
        self.attempts = np.zeros(n)
        self.efficiency = np.zeros(n)
        self.days = days
        self.verbose = verbose

    def update_efficiency(self):
        self.efficiency = self.sightings / (self.attempts + 0.0000001)

    def reset(self):
        self.sightings = np.zeros(self.n)
        self.attempts = np.zeros(self.n)
        update_efficiency()

    def print_statistics():
        print("Experiment Finished! :)")
        print("Estimated location sighting probabilities are:", self.efficiency)
        print("Actual location sighting probabilities are:", self.locations)
        sighting_chance = np.sum(self.sightings)/np.days
        print("Your average chance of sighting a bird was", sighting_chance*100,"% which is", sighting_chance/np.max(self.locations)*100, "% optimal!")

    def visit(self,location):
        p = np.random.random()
        if( p < self.locations[location]):
            self.sightings[location] += 1
        self.attempts[location] += 1
        update_efficiency()


    def epsilon_greedy(self,eps=0.1):

        self.reset()

        for day in range(self.days):
            p = np.random.random()
            if(p < eps or day == 0):
                location = np.random.randint(0,self.n)
            else:
                location = np.argmax(self.efficiency)
            self.visit(location)
        if(verbose):
            self.print_statistics()
Note that these variable names are chosen very specifically for our scenario. More conventional names would be arms instead of locations, pull instead of visit etc. As an exercise you could rename the variable to either be more general – or better yet you could rename them to fit your own imagined scenario! ;-)
Testing The Epsilon-Greedy Algorithm | How Good Is It?

So by now we’ve not only learnt what bandit problems are and a strategy for dealing with such problems – we’ve also written it in code. Let’s test it out and see how it helps Carl in spotting Great Potoos! We start by creating an instance of the bandit class and then call the epsilon_greedy method on it:
Input: bandit = Bandit(n = 5, days = 90)
Input: bandit.epsilon_greedy(eps = 0.1)

Output:
Experiment Finished! :)
Estimated location sighting probabilities are: [0.667, 0.987, 0., 0., 0.5]
Actual location sighting probabilities are: [0.75, 0.996, 0.175, 0.61, 0.26]
Your average chance of sighting a bird was 92.2% which is 92.5% optimal!

Input: bandit.attempts

Output: [10,74,4,1,1]
The bandit problem had 5 different locations of which the first, second and fourth had relatively high chances of spotting a bird, and the third and fifth had relatively speaking very low chances. When using eps = 0.1 we can see (looking at the estimated probabilities) that the algorithm indeed found which location was the most optimal. It also managed to find the second most optimal spot as well as quite accurately estimating the true chance of spotting at these spots. Our average chance of sighting was 92.2% compared to the optimal location which had a chance of sighting of 98.7%. This means that our algorithm achieved a sighting probability of 92.5% within the absolutely best possible probability that could theoretically been obtained! That is pretty good. Looking at the attempts made we can observe that the algorithm spent only 5 days out of 90 visiting the worst locations, spent 10 days on the second best location and a whooping 74 days or 82% of the attempts at the most promising location.
Let’s test the same problem but this time doing the pure exploration approach with an eps = 1. We would expect it to spend just about the same amount of time visiting each location and thus expect it to estimate all location probabilities pretty well, but with much lower optimality score.
Input: bandit.epsilon_greedy(eps = 1)

Output:
Experiment Finished! :)
Estimated location sighting probabilities are: [0.823, 1.00, 0.25, 0.588, 0.05]
Actual location sighting probabilities are: [0.75, 0.996, 0.175, 0.61, 0.26]
Your average chance of sighting a bird was 51.1% which is 51.3% optimal!

Input: bandit.attempts

Output: [17,16,20,17,20]
We can now see that it indeed more accurately estimates all the location probabilities. It also correctly identifies which location is the optimal. But we can see that the average chance of sighting was only 51.1%, about half the optimal location’s probability and even worse than the third best option! As expected, the price we pay for statistical rigour and a better model is that we spend a lot of days visiting low probability sites and as a result see fewer birds in total. And as the number of locations to explore or the number of days spent exploring increases we are likely to suffer even more from this! That is the price of certitude. But which approach is the best is of course dependent on what your aim is. For Carl, the aim was to maximise the times he saw his favourite birds. Had Carl instead been studying how location affects the chance of a Great Potoo staying there he might’ve been better off choosing the pure exploration method. As always in life you seldom have a single fits-all solution.
This result was just a single comparison for a single bandit problem. Also, 90 instances is quite a low number to run an experiment. Often you would have thousands of instances. So let’s analyse some more just because we can! And don’t forget to refill that coffee! :-)
Further Comparison And Analysis
We start by updating the Bandit class with the following method:
def get_optimality(self):
    reward = np.sum(self.sightings)/self.days
    if(np.argmax(self.efficiency) == np.argmax(self.locations)):
        correctness = 1
    else:
        correctness = 0
    return reward / np.max(self.locations) , correctness
This method will do two things. First it will compute the optimality in the form of our reward variable (this is average sightings per attempt). Then it will also tell if the algorithm successfully found the optimal arm, which will be returned in the form of the variable correctness. Having updated our bandit with this we are now ready to do a more systematic comparison between the epsilon-greedy algorithm and the A/B testing algorithm.
def run_simulation(simulations = 500, runs = 20, eps = 0.1, n = 5):

    H1 = np.zeros((simulations,runs)
    H2 = np.zeros((simulations,runs)
    C1 = np.zeros((simulations,runs)
    C2 = np.zeros((simulations,runs)

    for sim in range(simulations):
        bandit = Bandit(n = n, days = 1000, verbose = False)
        for run in range(runs):
            bandit.epsilon_greedy(eps=eps)  # epsilon-greedy, eps=0.1
            H1[sim,run],C1[sim,run] = bandit.get_optimality()
            bandit.epsilon_greedy(eps=1)    # pure exploration, eps=1
            H2[sim,run],C2[sim,run] = bandit.get_optimality()

    return H1,H2,C1,C2

def plot_results(H1,H2):
    f,ax = plt.subplots(1,figsize(15,5))
    plt.plot(np.mean(H1,axis=1),label="Epsilon-Greedy")
    plt.axhline(y=np.mean(H1),c='r')
    plt.plot(np.mean(H2,axis=1),label="A/B Testing")
    plt.axhline(y=np.mean(H2),c='r')
The run_simulation method creates a number of simulations. In each simulation a unique bandit is created, and then the epsilon-greedy and the A/B testing algorithms are tested over several runs on that bandit. The method returns the optimality scores H for both algorithms as well as whether the algorithm correctly identified the best arm. The results can then be plotted with the method plot_results. In order to get a better view of the asymptotic behaviour of the algorithms we let each experiment run for a 1000 days. Running the above yields the results shown below.
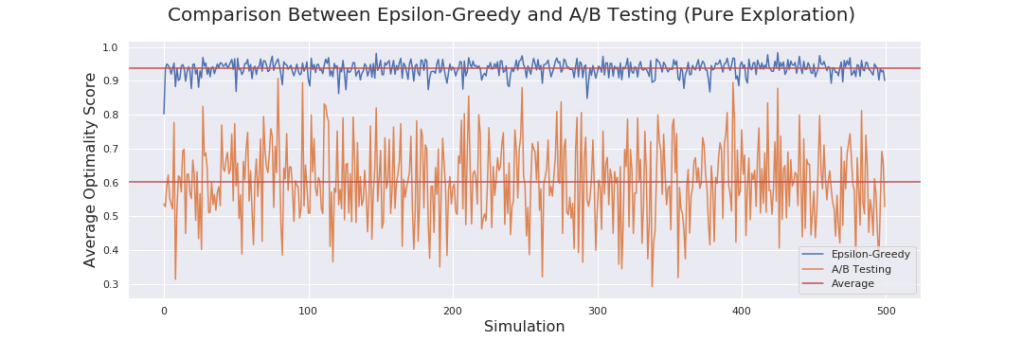
The difference in optimality is striking! The A/B testing, blindly testing all options available in no order, generally achieves results that are within 60% the value of the optimal strategy. In contrast the epsilon-greedy algorithm achieves a value with a whopping 92% of the optimal strategy! It is also noteworthy that the epsilon-greedy algorithm varies very little in optimality compared to the A/B testing algorithm. Sometimes A/B is as high as the epsilon-greedy for the corresponding simulation and other times it is far far below. Remember that each simulation is a unique bandit problem with 5 locations each with random probabilities – and some bandits will naturally be harder than others.
Now, you might object that this is an unfair comparison since epsilon-greedy is designed to make optimal choices during testing and A/B strives to be very correct in it’s prediction – and you are right! But looking at the correctness of both algorithms we find something surprising:
Input: np.mean(C1)     #Epsilon-greedy
Output: 0.896

Input: np.mean(C2)     #A/B Testing
Output: 0.9242
While the A/B testing algorithm does get it right more times than the epsilon-greedy algorithm, the difference is not as big as one might suspect! (Disclaimer: remember that this is for a relative simple test case and this is no way are metrics you should act on without first conducting your own experiments – as always). Sometimes that 2.5% difference really does makes a difference, if the results of the test will be crucial then you should definitely use as statistically rigorous methods as you can. And 2.5% is only in this case. Naturally this might vary. But generally the price for that extra certitude might be very costly, considering the lost opportunities during the testing.
Let’s do another analysis looking at how the Epsilon-Greedy algorithm makes choices and optimality convergence! To do this we modify the Epsilon-Greedy algorithm to keep track of which location we visit each day. The algorithm thus looks like this:
def epsilon_greedy(self,eps=0.1,return_stats=False):
self.reset()
location_visited = np.zeros((self.n,self.days))
for day in range(self.days):
p = np.random.random()
if(p < eps or day == 0):
location = np.random.randint(0,self.n)
else:
location = np.argmax(self.efficiency)
location_visited[location,day] += 1
self.visit(location)
if(verbose):
self.print_statistics()
if(return_stats):
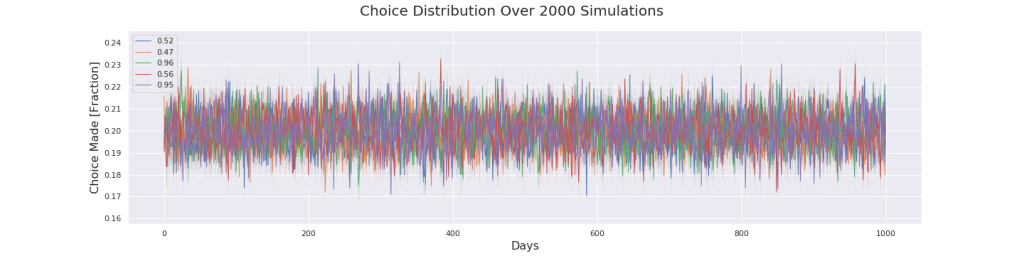
return location_visistedWith this method we just need to create our bandit and then run the epsilon_greedy method on it several times and saving the statistics of locations visited for each run. Then we take the average action taken for every time step and we then plot the choices using matplotlib. To make it interesting let’s consider the following problem setup: Three of the locations are very close to each other in terms of probability, let’s say around 50%, and the two remaining locations are very high probability and very close to each other at 95% and 96% percent respectively. We start with epsilon = 0.1 and we run it for 2000 simulations and 1000 days with this setup.
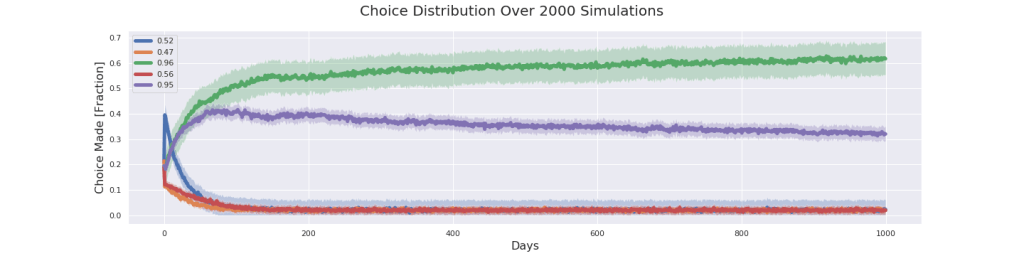
As we can see the algorithm generally converges to the correct location (green location), but it also chooses the purple location many times. Now, remember that this is the average action taken over 2000 simulations. In 1331 instances of the 2000 simulations the algorithm correctly identified the green location as the optimal one and in 669 instances it falsely identified the purple location as optimal. Given how close these two are those are pretty acceptable results. In no instances does the algorithm choose any of the clearly inferior locations orange, red and blue.
We can see that the green location is chosen over the purple location more the more days the experiment is run for. The way to interpret this is that the algorithms are split which is the optimal location, but as time grows on they decide on the green location more. Probably by letting the experiment run for even longer the purple fraction would tend to the same levels as the orange, red and blue. But then again, why leave that question unanswered when you can burn your Nvidia graphics card to a crisp? Let’s run the same experiment but this time for 15,000 days!
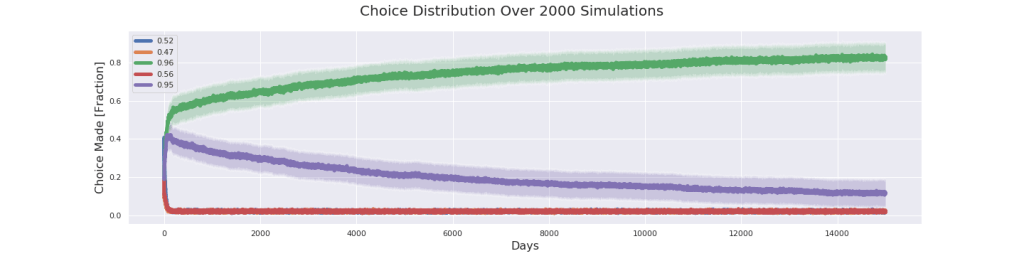
Okay, as assumed in more instances the algorithm found the correct algorithm. In 1701 cases the green location was chosen as the optimal one and in only 299 cases the purple location was chosen. We can clearly see the trend that the purple joins the others as predicted. But it’s still not there. Unsatisfied let’s crank it up to 11 and test for 40,000 days!
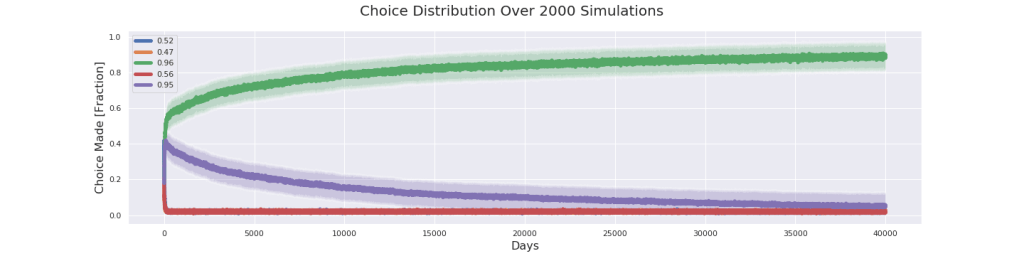
Alright this is about as close as I have patience to go. I’m convinced that the purple line will eventually join the others. At 40,000 days the purple has more or less reached the bottom. In 1931 cases the green location was chosen as optimal and in only 69 cases the purple one was chosen. What this tells me is that it is likely that as the algorithm goes on for longer it converge to the correct choice even when the problem is very tricky.
Now it is interesting to compare these results to our friend A/B testing so let’s do that! We test for both 1000 days and 15,000 days.
The graphs themselves are neither surprising nor very interesting. What it tells us is that the algorithm chooses randomly, which we already knew. What is more interesting is to look at the which choice it selects as the best one. For 1000 days the A/B testing selects the green in 1385 cases out of 2000 simulations, and the purple one in 615 cases. Compared to the Epsilon-Greedy algorithm (669 purple cases) this is only marginally better! But cranking the number of days up to 15,000 the A/B testing starts to shine! Over 15,000 days the A/B testing selects the green in 1952 cases and the purple in only 48 cases. This is even better than the Epsilon-Greedy when it ran for 40,000 days! Interesting.
Closing Remarks
Okay! So that was it! In this post we got to implement the epsilon-greedy algorithm in python code and then do some fun analysis.
Next Up: RL I: Learning Agents|A Brief Overview
I hope you found these two posts enlightening and entertaining to read! I know at least that I thoroughly enjoyed writing about this topic and I learnt a great deal along the way. As always until next time, stay hungry and keep on learning!
